The 30A Beaches real estate market has experienced several notable changes when comparing data from September 12, 2023, to the year-to-date statistics from both 2022 and 2023. This analysis will provide insights into key trends and shifts in the market.
ACTIVE LISTINGS AS OF SEPTEMBER 12TH, 2023:
- Total Number of Homes: 637
- Average List Price: $3,236,527
- Average List Price per SQFT: $937.39
- Average Days on Market (DOM): 153 Days

YEAR-TO-DATE COMPARISON (01.01.2022 – 08.31.2022 vs. 01.01.2023 – 08.31.2023):
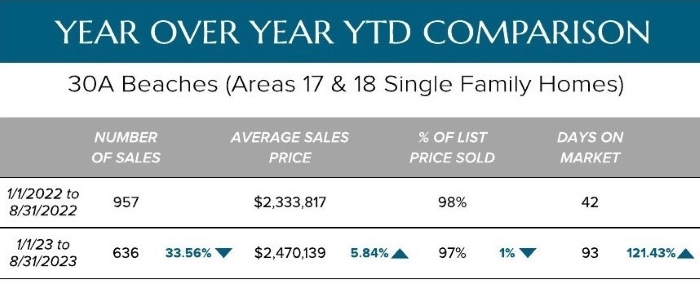
- Number of Listings Sold:
- In 2022, 957 listings were sold.
- In 2023, 636 listings were sold.
- This represents a significant decrease of 33.56% in the number of properties sold.
- Average Sold Price (AVG Sold $):
- In 2022, the average sold price was $2,333,817.
- In 2023, the average sold price increased to $2,470,139.
- This indicates a 5.84% increase in the average sold price year over year.
- Average Price per SQFT Sold:
- In 2022, the average price per square foot (SQFT) sold was $766.02.
- In 2023, the average price per SQFT sold increased to $797.59.
- This signifies a 4.12% increase in the average price per SQFT sold year over year.
- List to Sales Price:
- In 2022, the list to sales price ratio was 98%.
- In 2023, it decreased slightly to 97%.
- This suggests a 1% decline in the percentage of the list price that homes are selling for.
- Cumulative Days on Market (DOM):
- In 2022, the cumulative DOM was 42 days.
- In 2023, the cumulative DOM increased significantly to 93 days.
- This reflects a substantial 121.43% increase in the average time it takes for properties to sell.

KEY TAKEAWAYS:
- Decreased Sales Volume: The most striking trend is the significant decrease in the number of listings sold from 2022 to 2023. This could indicate decreased demand, economic factors, or other market-specific conditions that have impacted sales activity.
- Price Appreciation: While the number of sales declined, the average sold price and average price per SQFT increased in 2023. This suggests that despite lower sales volume, the properties that did sell achieved higher prices, potentially due to limited inventory or desirable location factors.
- Slightly Lower List-to-Sales Price: The list to sales price ratio decreased by 1% in 2023, indicating that buyers may have slightly more negotiating power compared to the previous year.
- Extended Time on Market: The most concerning trend is the significant increase in cumulative DOM, which has more than doubled from 2022 to 2023. Properties are taking longer to sell, which could be due to increased competition or other market dynamics.
The 30A real estate market has seen a notable shift from 2022 to 2023, with a decrease in sales volume, slightly higher prices, and extended time on market. Buyers and sellers should be mindful of these trends when making real estate decisions, and market conditions should continue to be monitored for potential changes in the future.
